Service-level management
Service-level management (SLM) is defined and monitors the quality of IT services provided. It is an ITIL process discipline whose goal is to bring the performance of IT services permanently in line with customer expectations.
The implementation is based on the approach of the Google: SRE fundamentals 2021: SLIs vs SLAs vs SLOs
Service-level management in Versio.io offers the following functionalities:
- Definition of service-level agreements (SLA) to group service level objectives.
- Definition and identification of service-level objectives (SLO) to determine service quality in terms of availability and performance (latency).
- Visualization of SLO status over time as well as their metrics (error budget) in a dashboard.
- Accounting of penalty payments based on SLO definitions and SLAs.
Service-level aggrements and service-level objectives are stored in Versio.io in the Asset & Configuration Item Inventory. This allows standard functionalities of the Versio.io platform, such as reporting or IT governance, to be available and the data to be used by customers via One-API.
Service-level agreements
Service-level aggrements represent a grouping element for service-level objectives. The grouping can be used as filtering in the dashboard and as containment for penalty calculation.
SLOs are assigned to one or more SLAs in the SLO importer configuration.
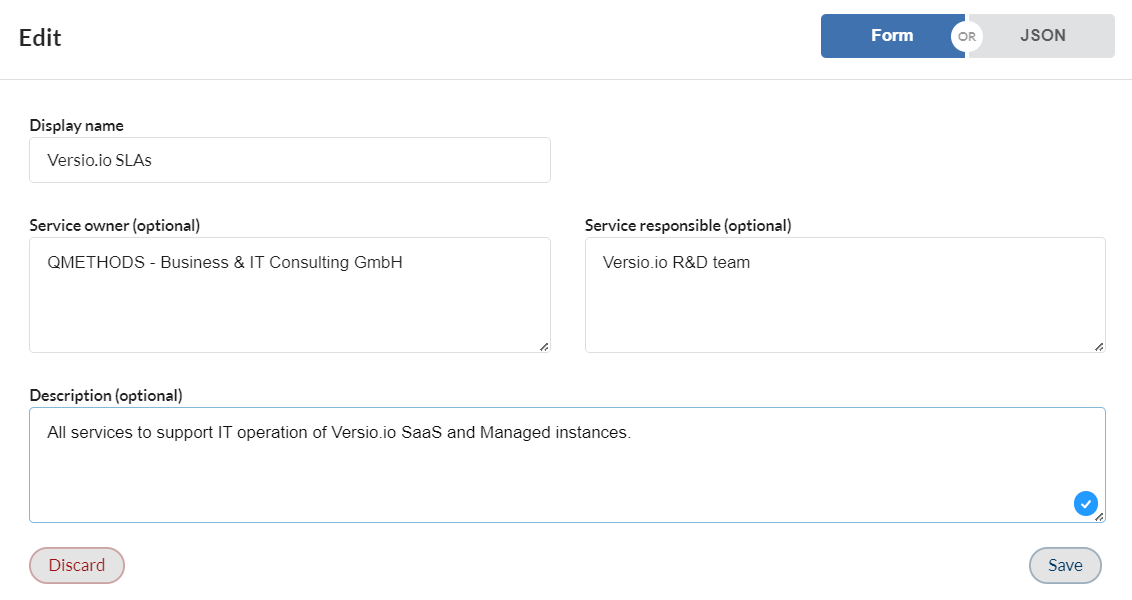
Figure: Service-level agreement editor
Service-level objectives
Configuration
Service-level objectives can be defined in Versio.io as an inventory configuration. Here, availability and performance can be defined as quality criteria. Based on the configuration, the SLO are then continuously recorded by OneGate. All details about the SLO configuration can be found here.
The following availability and latency (performance) measurements are support:
- Supports
- HTTP requests for surveying web-based applications and APIs.
- Support planned (customer requests welcome)
- HTTP requests for surveying content of web-based APIs
- PING for surveying IP-based devices and components (host, virtual machine, network device, etc.)
- SSH incl. login for measuring SSH services (host, virtual machine, network device etc.)
- Database queries for the measurement of database management systems
- Database queries for surveying database contents
- SSH for measuring metrics of operation systems (host, virtual machine, network device, etc.)
Dashboard
The Service-level Management Dashboard provides users with an overview of the status over time and the control-relevant metrics of the individual SLOs as well as their totality depending on a freely selectable time period.
Strong filtering capabilities allow the dashboard to be filtered to a specific SLA or SLO, or an individual time period under consideration. Please note that all metrics (availability, error budget) are always calculated on the basis of the observation period!
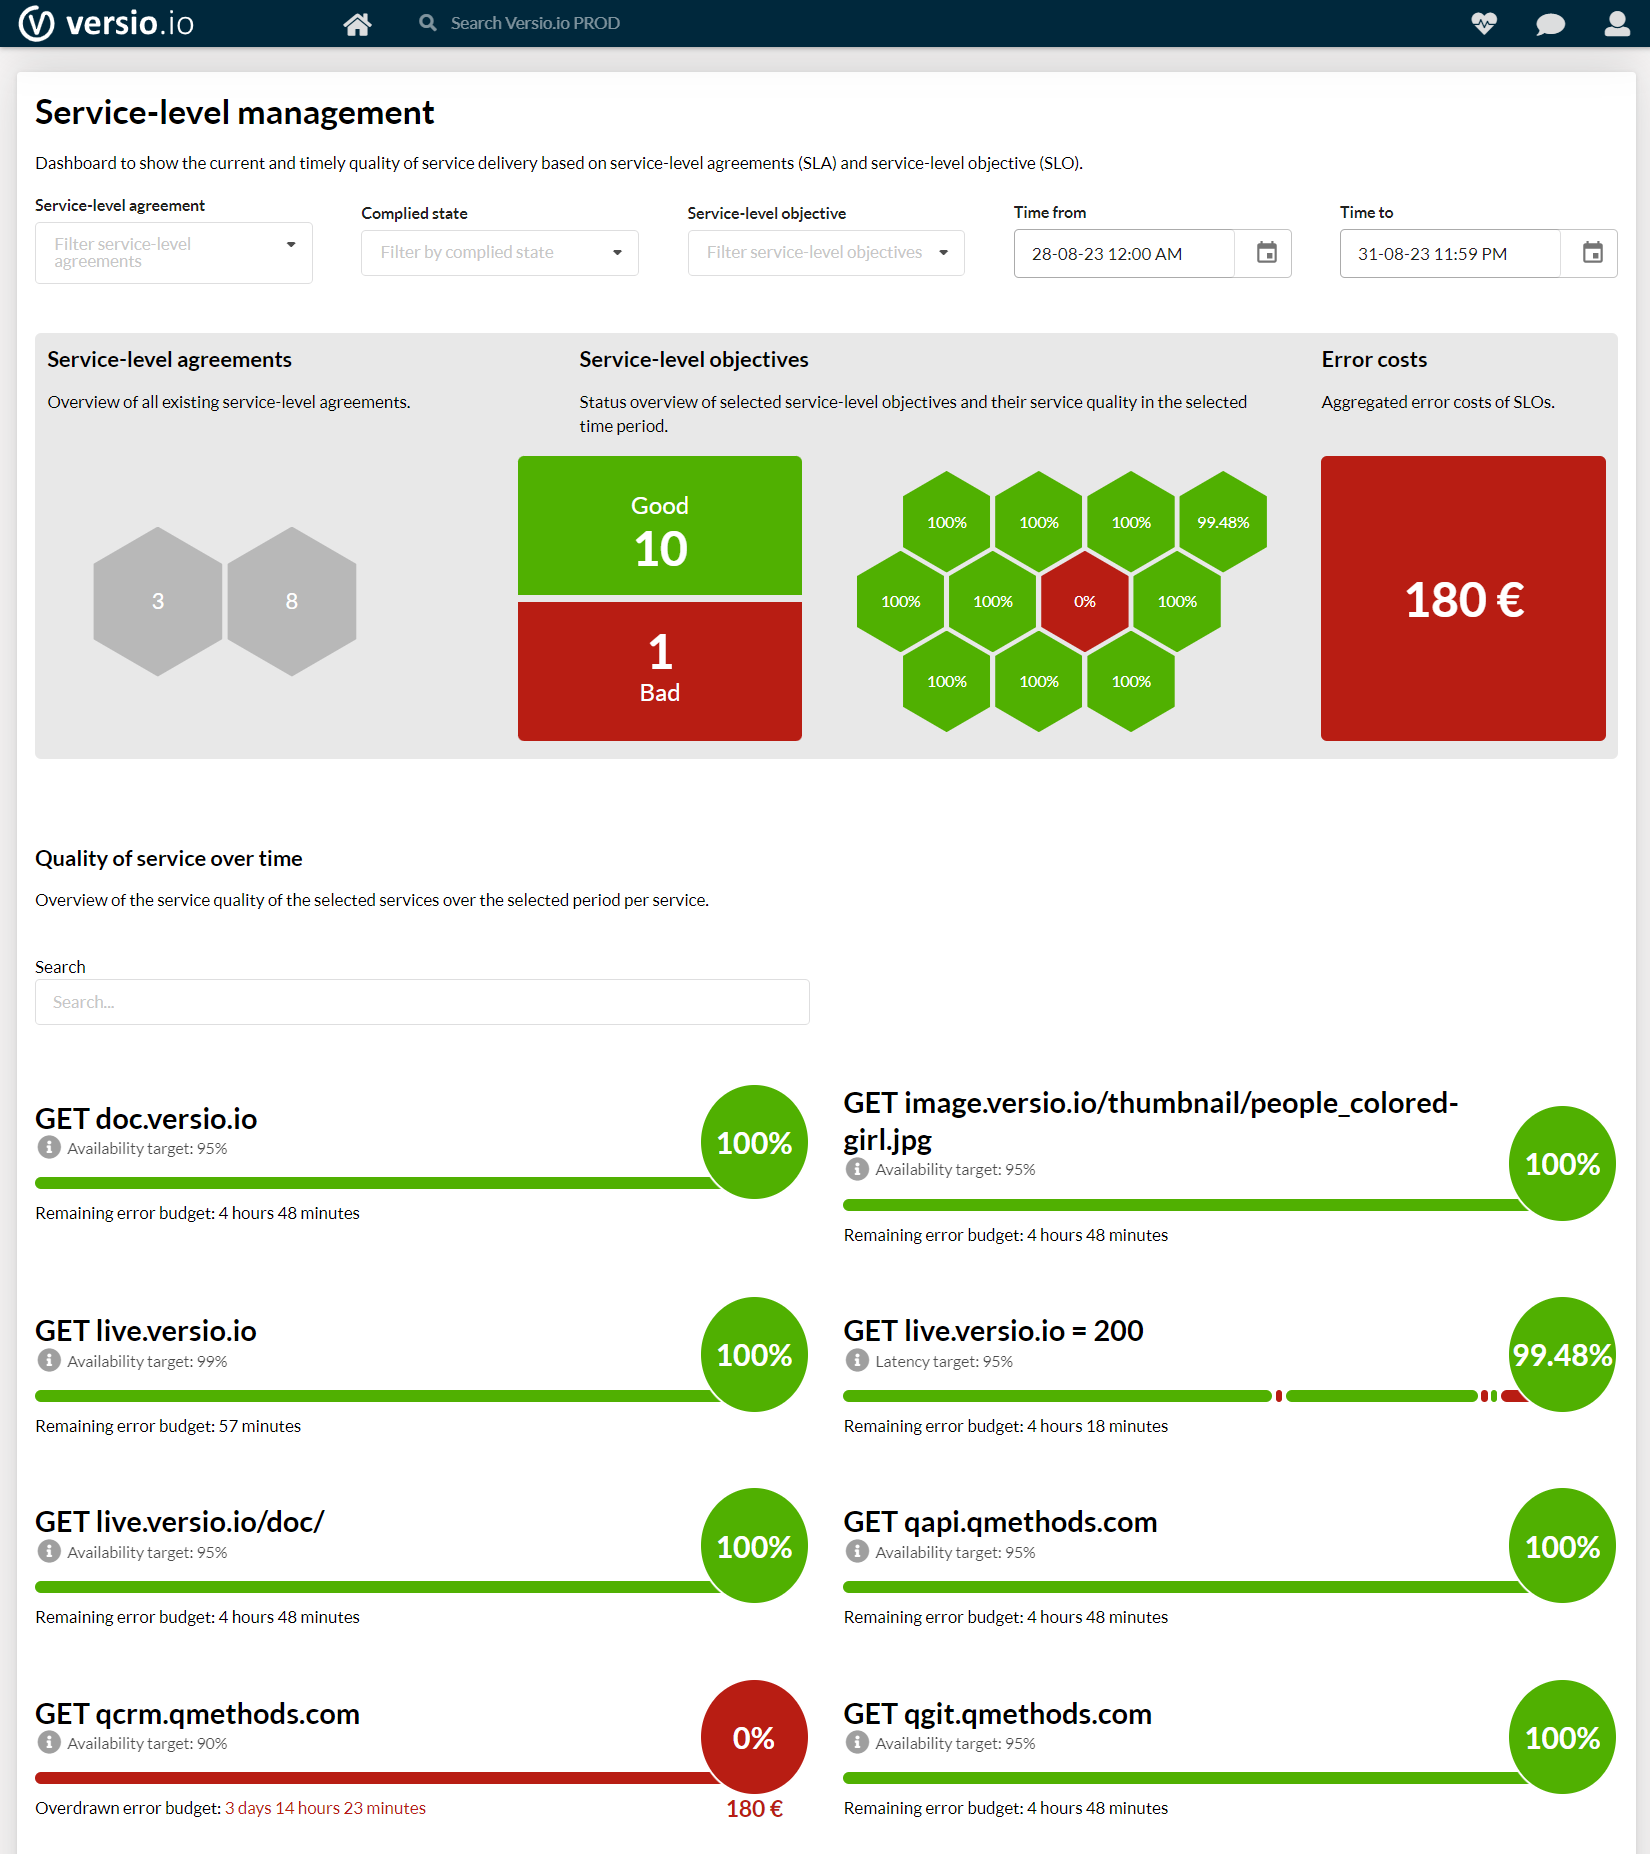
Figure: Service-level management dashboard
The following table shows which status an SLO can assume in its lifetime and how this is evaluated by the assessment engine:
| SLO status | Description | Rating |
|---|---|---|
Service available |
The service is available in the defined quality. | GOOD |
Service not available |
The service is not available in the defined quality. | NOT GOOD |
Service forecast |
The SLO data for a point in time in the future is not yet available. Starting from the last status, this will be used as a forecast. | GOOD or NOT GOOD |
No service data available |
There is no SLO data available for the time period. The SLO measurement data collection has started at a later time. | NOT RELEVANT |
Service is mark as deleted |
No SLO data available for the time period. SLO measurement data is no longer collected (SLO instance is marked as deleted). | NOT RELEVANT |
Service data outside the historization time |
The SLO data is outside the history time (subscription) and no longer available. | NOT RELEVANT |
Table: SLO status and interpretation
The error budget is calculated based on the SLO target and the period under analysis. The following representations are supported: * Error budget % = 100% - SLO target * Error budget time = 100% - SLO target * Observation period * Overdrawn error budget time = 'NOT GOOD' rating time - Error budget time
The analysis time is to be considered urgently in the dashboard, since e.g. status and costs are always calculated for the special analysis period!
Penalty billing
All SLOs with the status 'NOT RELEVANT' are not considered in the evaluation. This means that the period considered is reduced accordingly. The error costs are only included for SLOs that have exceeded the allowed error costs and are calculated as follows:
Error costs=Overdrawn error budget time*Cost per time unit